News Releases
Large-Scale Office Building Supply Survey for Tokyo’s 23 Wards 2024
Mori Trust Co., Ltd. (Head office: Minato-ku, Tokyo; President: Miwako Date) announces the latest survey results on office supply trends in Tokyo’s 23 wards. We have been conducting surveys and analysis once a year on supply trends for large office buildings (total office floor area of 10,000 ㎡ or more) in Tokyo’s 23 wards since 1986, and for medium-sized office buildings (total office floor area of 5,000 ㎡ or more but less than 10,000 ㎡) since 2013. (*For mixed-use buildings including stores, residences, hotels, etc., the total floor area excludes uses other than offices.)
[Survey Date: December 2023]
Although there will be a large supply in 2023, the trend of supply restraint will continue from 2024 onwards
Key Points of the Survey results
- 1. Trends in Supply Volume
- The supply of large-scale office buildings in 2023 was 1.38 million ㎡, the second largest supply in the past five years after 2020.
- In the five years from 2024 onwards, no year will exceed 2023, and the average supply over the next five years is expected to remain at 850,000 ㎡, lower than the average of 1,070,000 ㎡ over the past 20 years, indicating that supply is expected to be suppressed.
- 2. Trends Supply Areas
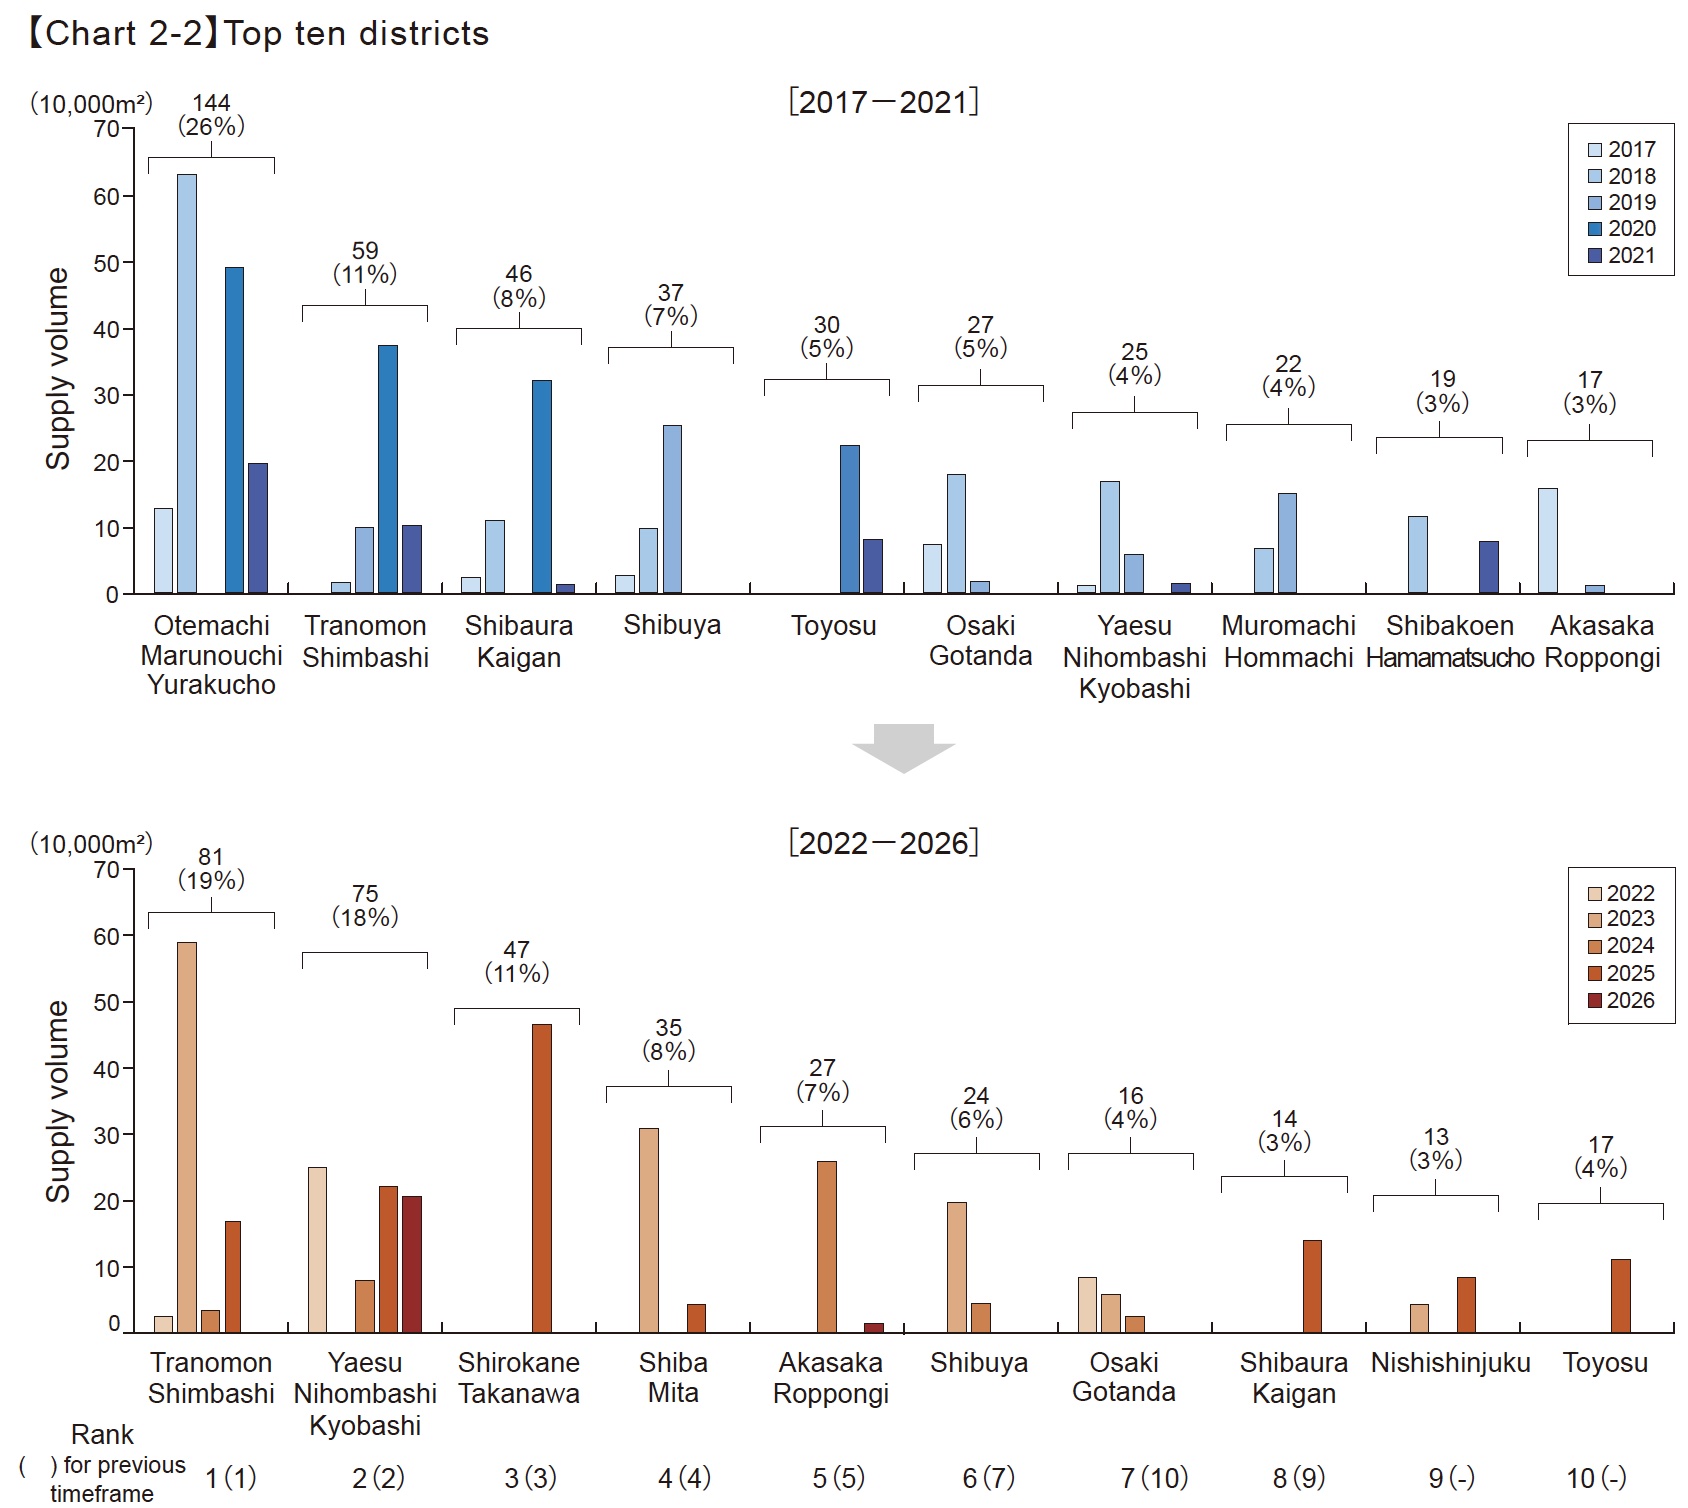
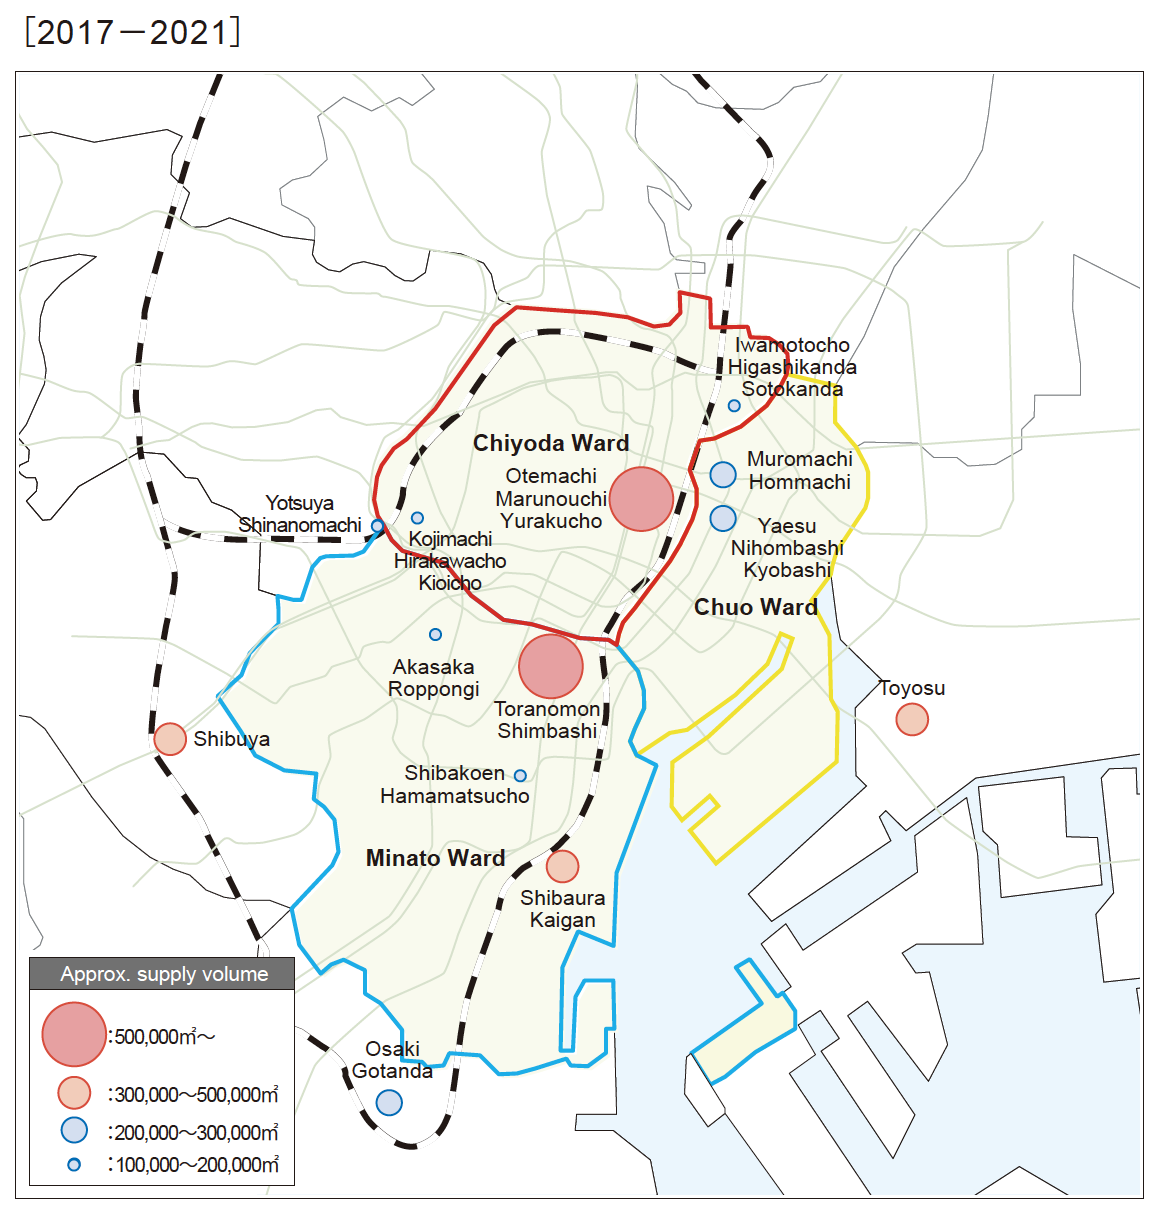
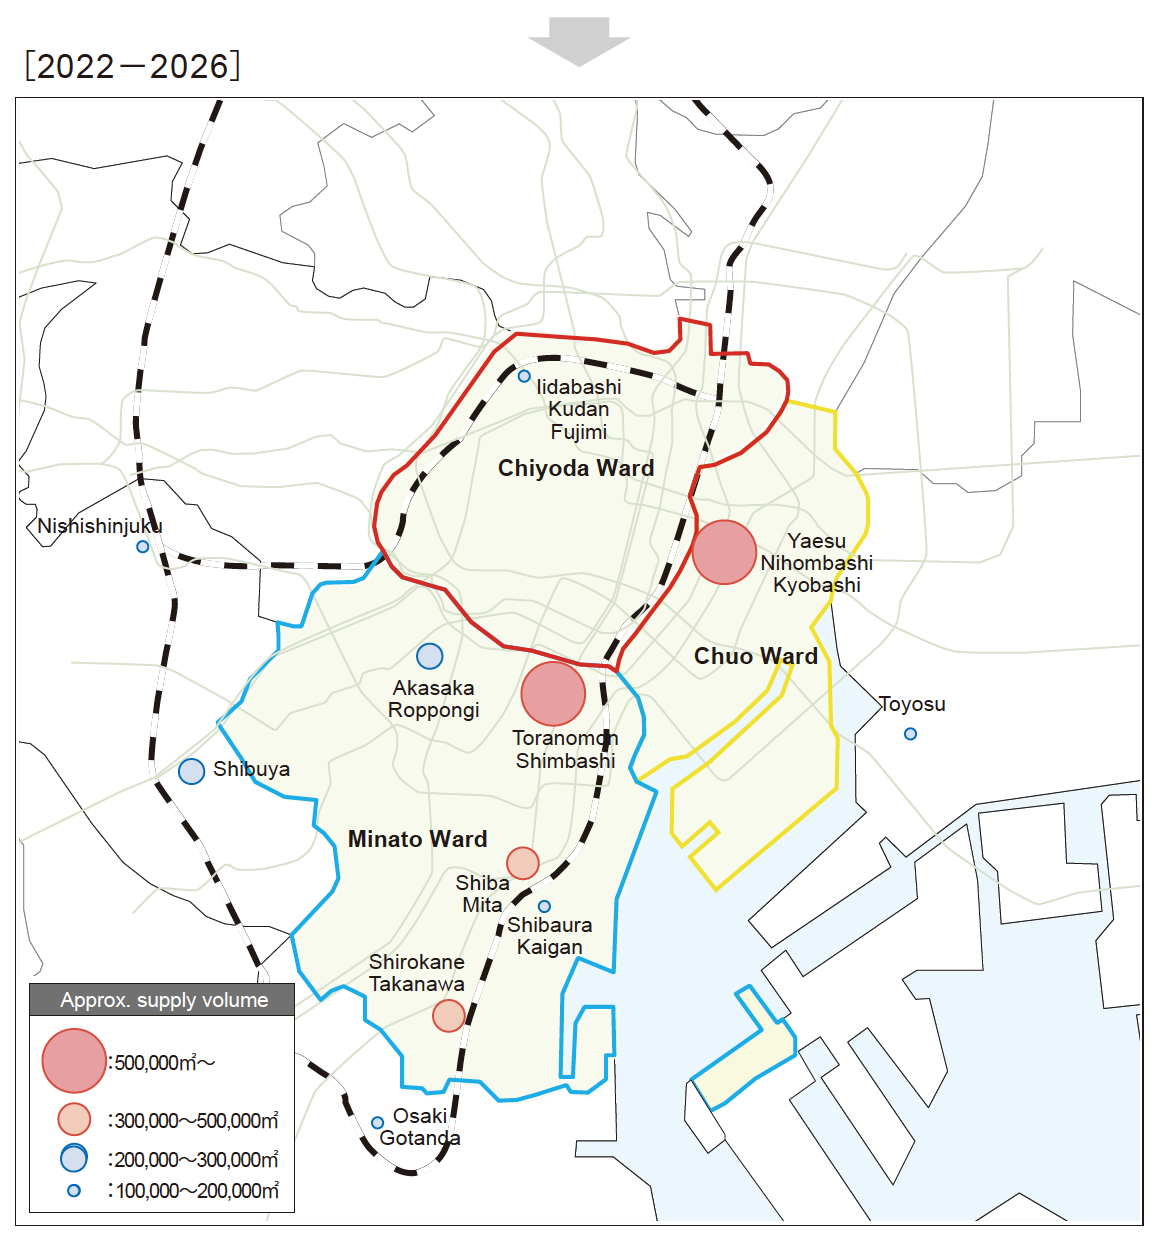
During the period from 2022 to 2023, the supply in Tokyo’s three central wards will remain over 70%. In the next five years, the supply share of Chiyoda Ward will decrease, and the share of Chuo Ward and Minato Ward will increase. In particular, Minato Ward will account for 50% of the total, and supply will increase mainly in Minato Ward. Otemachi, Marunouchi, and Yurakucho, which had an outstanding supply volume in the past five years, will fall out of the top 10 districts in the next five years. On the other hand, the development will proceed in Minato Ward, such as Toranomon and Shimbashi, Shirokane and Takanawa, Shiba and Mita, Akasaka and Roppongi, and Shibaura and Kaigan. - 3. Supply Trends by Development Site
In the three central wards of Tokyo, the proportion of “reconstruction” was approximately 80% between 2014 and 2018, but has fallen to 40% since 2019, with the majority of development land shifting to “underutilized and unused land (redevelopment, etc.)” Outside the three central wards, “underutilized and unused land (redevelopment, etc.).” have constituted the main areas of development since 2014. (The definitions of “reconstruction” and “underutilized and unused land (redevelopment, etc.)” are described below.) - 4. Supply Trends of Medium-sized Office Buildings
The supply of medium-sized office buildings in 2023 was 66,000 m2, marking another decrease compared to 2022, when there was a large supply. Although it is expected to fluctuate to 124,000 m2 in 2024 and 67,000 m2 in 2025, the average supply over the next two years will be 96,000 m2, roughly equivalent to the average over the past 10 years, and supply is expected to remain stable.
Summary
Although there will be a large supply in 2023, the trend of supply restraint will continue from 2024 onwards
The supply of large-scale office buildings in 2023 was 1.38 million m2, the second largest supply in the past five years after 2020. On the other hand, the average supply over the five years from 2024 onwards is expected to be lower than the average supply over the past 20 years, so future supply trends are likely to be subdued.
Although there were concerns that the market would deteriorate in 2023 due to the massive supply of large-scale offices, the vacancy rate has actually shown trend toward recovery, and demand for offices has remained strong. The reasons behind this include an increase in the rate of people going to work and the normalization of economic activity.
From 2021 to 2022, there were many relocations due to reasons such as reducing rent and reducing office space due to teleworking, but in 2023, there was an increase in relocations due to business expansion, increasing staff numbers, and strengthening recruitment.
As such, while demand for office space expands due to revitalized corporate activity, the supply of new office buildings is likely to be restrained going forward, and vacancy rates are expected to improve at an accelerating pace. Against this, there is a growing polarization between buildings that can find tenants even with high rents and buildings that cannot find tenants unless the rent is lowered, and trends for each building and area are attracting attention.
One year since COVID-19 was classified as Category 5: Supply of high-value-added office buildings stimulates further office demand
It has been one year since COVID-19 was classified as Category 5 on May 8, 2023. As places of work and working styles have become more diverse, the value of offices has been redefined, and they are now seen as spaces that support corporate growth and investment targets for attracting talent, rather than simply as workplaces or costs for business operations. In recent years, there have been an increasing number of examples in which the elements necessary to achieve these goals have been incorporated into the design.
Specifically, these elements are wide-ranging and comprised of various factors, including and in addition to the embodiment and realization of a corporate identity that contributes to improving employee engagement and a sense of belonging, they also include the promotion of interaction and collaboration that contributes to innovation and business promotion, and the pursuit of comfort that contributes to employee wellness and improved productivity.
In addition, in order to respond to various social changes and changes in needs in the future, it is essential that practices be varied and flexible, and be designed with consideration of SDGs and ESG.
As society changes and companies are required to change accordingly, the roles that offices should play will become more diverse and sophisticated. The supply of high-value-added offices is expected to revitalize the market and strongly stimulate demand.
1. Trends in Supply Volume
The supply of large-scale office buildings in Tokyo’s 23 wards in 2023 was 1.38 million m2, the second largest supply in the past five years after 2020.
Looking at the supply volume over the five years from 2024 onwards, there will be no year that exceeds the supply volume of 2023, and the highest supply volume over the next five years, 2025, at 1.18 million m2, is not a large area compared to the annual supply volume over the past 20 years. In addition, supply is expected to be kept low at 650,000 m2 in 2024, 600,000 m2 in 2027, and 780,000 m2 in 2028, so the average supply over the next five years is expected to remain at 850,000 m2, lower than the average supply of the past 20 years, which was 1.07 million m2. The supply of large-scale office buildings continues to be subdued. [Figure 1-1]
As a result of calculating supply shares of new office space after tallying the supply by ward and dividing them into the three central wards and other wards, the supply corresponding to the three central wards will consistently exceed 70% over the next five years. The pillar of supply continues to be Tokyo’s three central wards. [Figure 1-2]
When tracking trends in the supply of large-scale buildings by size over five-year periods, the supply by size was balanced between 2004 and 2008 and between 2009 and 2013, but from 2014 to 2018 the proportion of buildings with office floor space of 100,000 m2 or more began to rise, exceeding 50%, and will exceed 60% between 2024 and 2028. The trend of large-scale office buildings toward ultra-large-scale buildings continues. [Figure 1-3]


2.Trends Supply Areas
Supply trends of large-scale office buildings are investigated by area.When the supply share for the past five years and the next five years are tallied by ward, the share for Tokyo’s three central wards exceeds 70% for both In the breakdown of the three wards in central Tokyo, the proportion of Chiyoda Ward has decreased from the past five years to the next five years, while that of Chuo Ward and Minato Ward has increased. Among other wards, Shibuya Ward, which had a large proportion of development over the past five years, has completed its development, and Shinagawa Ward’s proportion is expected to increase over the next five years. [Figure 2-1]
When comparing the top 10 districts after tabulating the changes in supply by district, supply in “Toranomon/Shinbashi,” which had been at the top for the past five years, has slowed, and over the next five years “Yaesu/Nihonbashi/Kyobashi” will sustain the largest supply. In addition, “Shirokane/Takanawa” and “Akasaka/Roppongi,” which were out of the rankings for the past five years, are expected to rise to second and third place, respectively, over the next five years, and development in the Minato Ward area, which includes these districts, is expected to become more active from 2024 onwards. [Figure 2-2] [Figure 2-3]
*Data showing percentages may not add up to 100% because they are rounded off to the nearest whole number.

【Chart 2-3】Supply volume in the key business districts
3. Supply Trends by Development Site
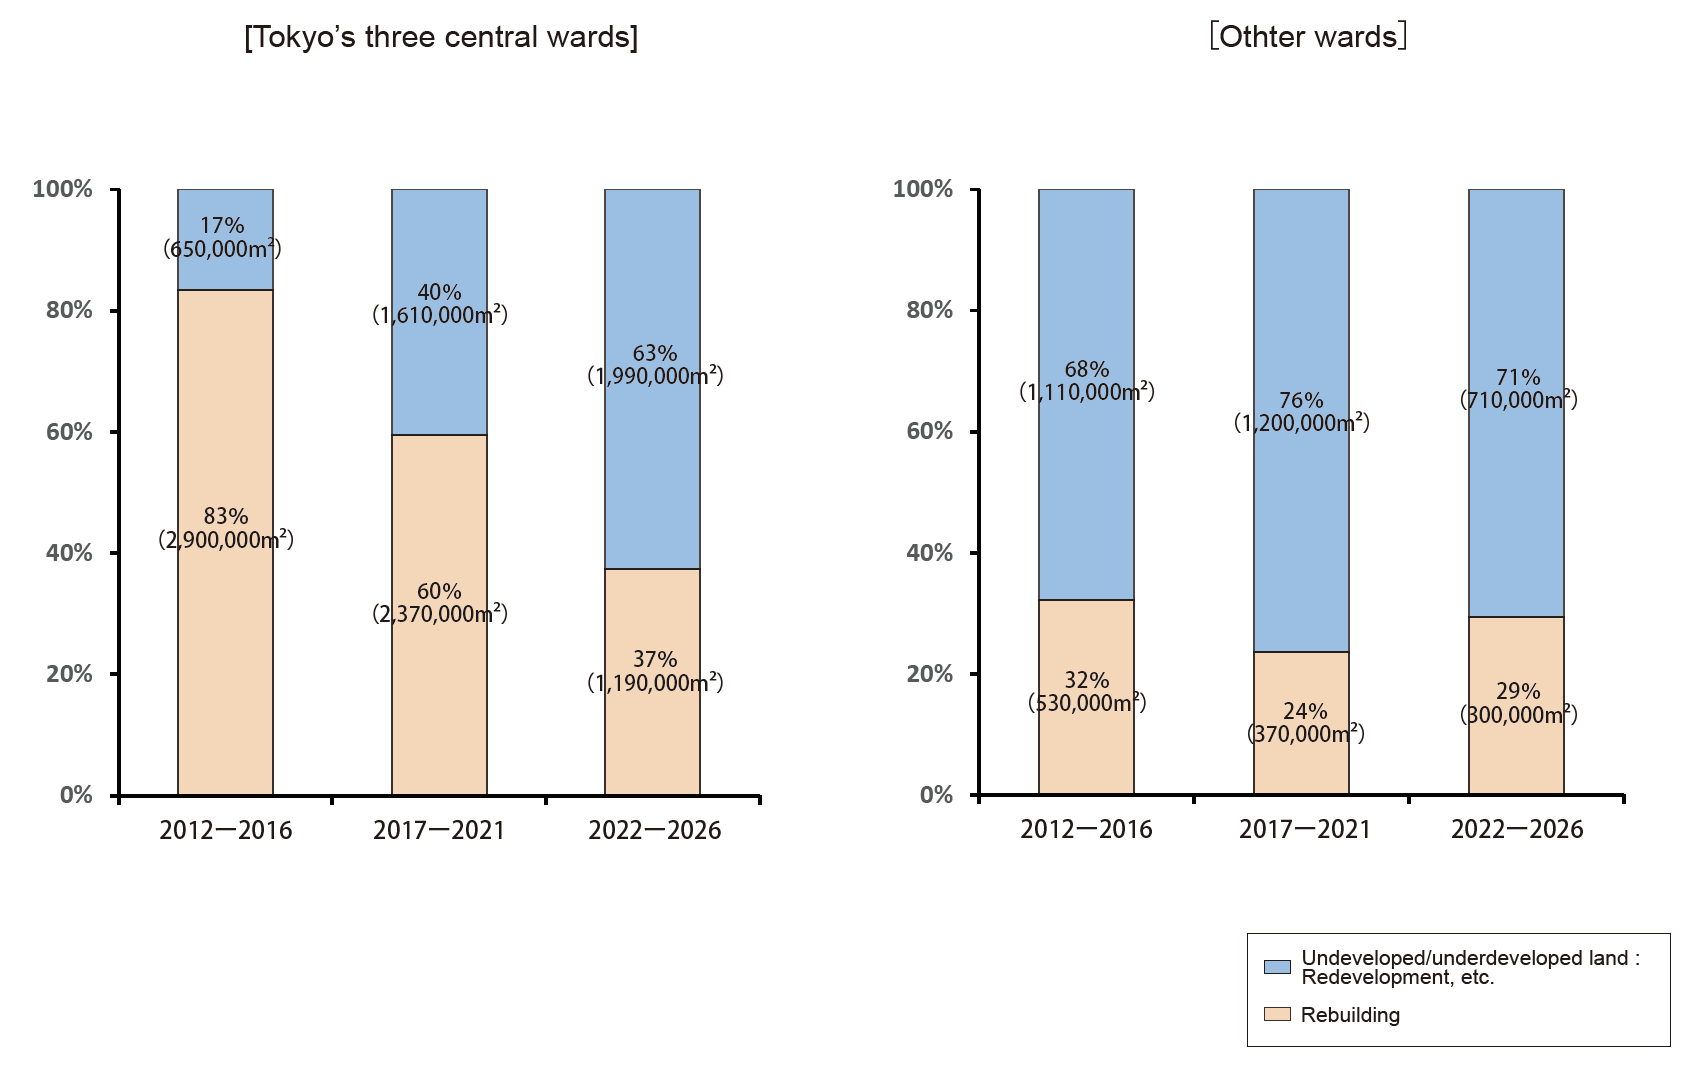
The supply ratio by development site type since 2014 was compiled in five-year increments.
In the three central wards, the proportion of “reconstruction” was approximately 80% between 2014 and 2018, but has fallen to 40% since 2019, with the majority of development land shifting to “underutilized and unused land (redevelopment, etc.)” On the other hand, outside the three central wards, “underutilized and unused land (redevelopment, etc.)” has continued to be the main developer since 2014.
The supply of large-scale office buildings is centered on “underutilized and unused land (redevelopment, etc.)” within and around the three central wards of Tokyo. [Figure 3-1]
【Chart3-1】Supply volume and ratio by land for development
[Definition of Terms]
“Rebuilding”: The site that used to be used for offices, hotels, and houses was demolished (development in).
“Underutilized and unused land”: land that was intended for highly effective use, such as development of small buildings, etc., moth-eaten land with a mixture of parking lots and old buildings, dense residential areas, former factory sites, railway sites, idle land, etc.
4. Supply Trends of Medium-sized Office Buildings
This section describes the supply trends of medium-sized office buildings with a total floor area between 5,000m2 and 10,000m2.
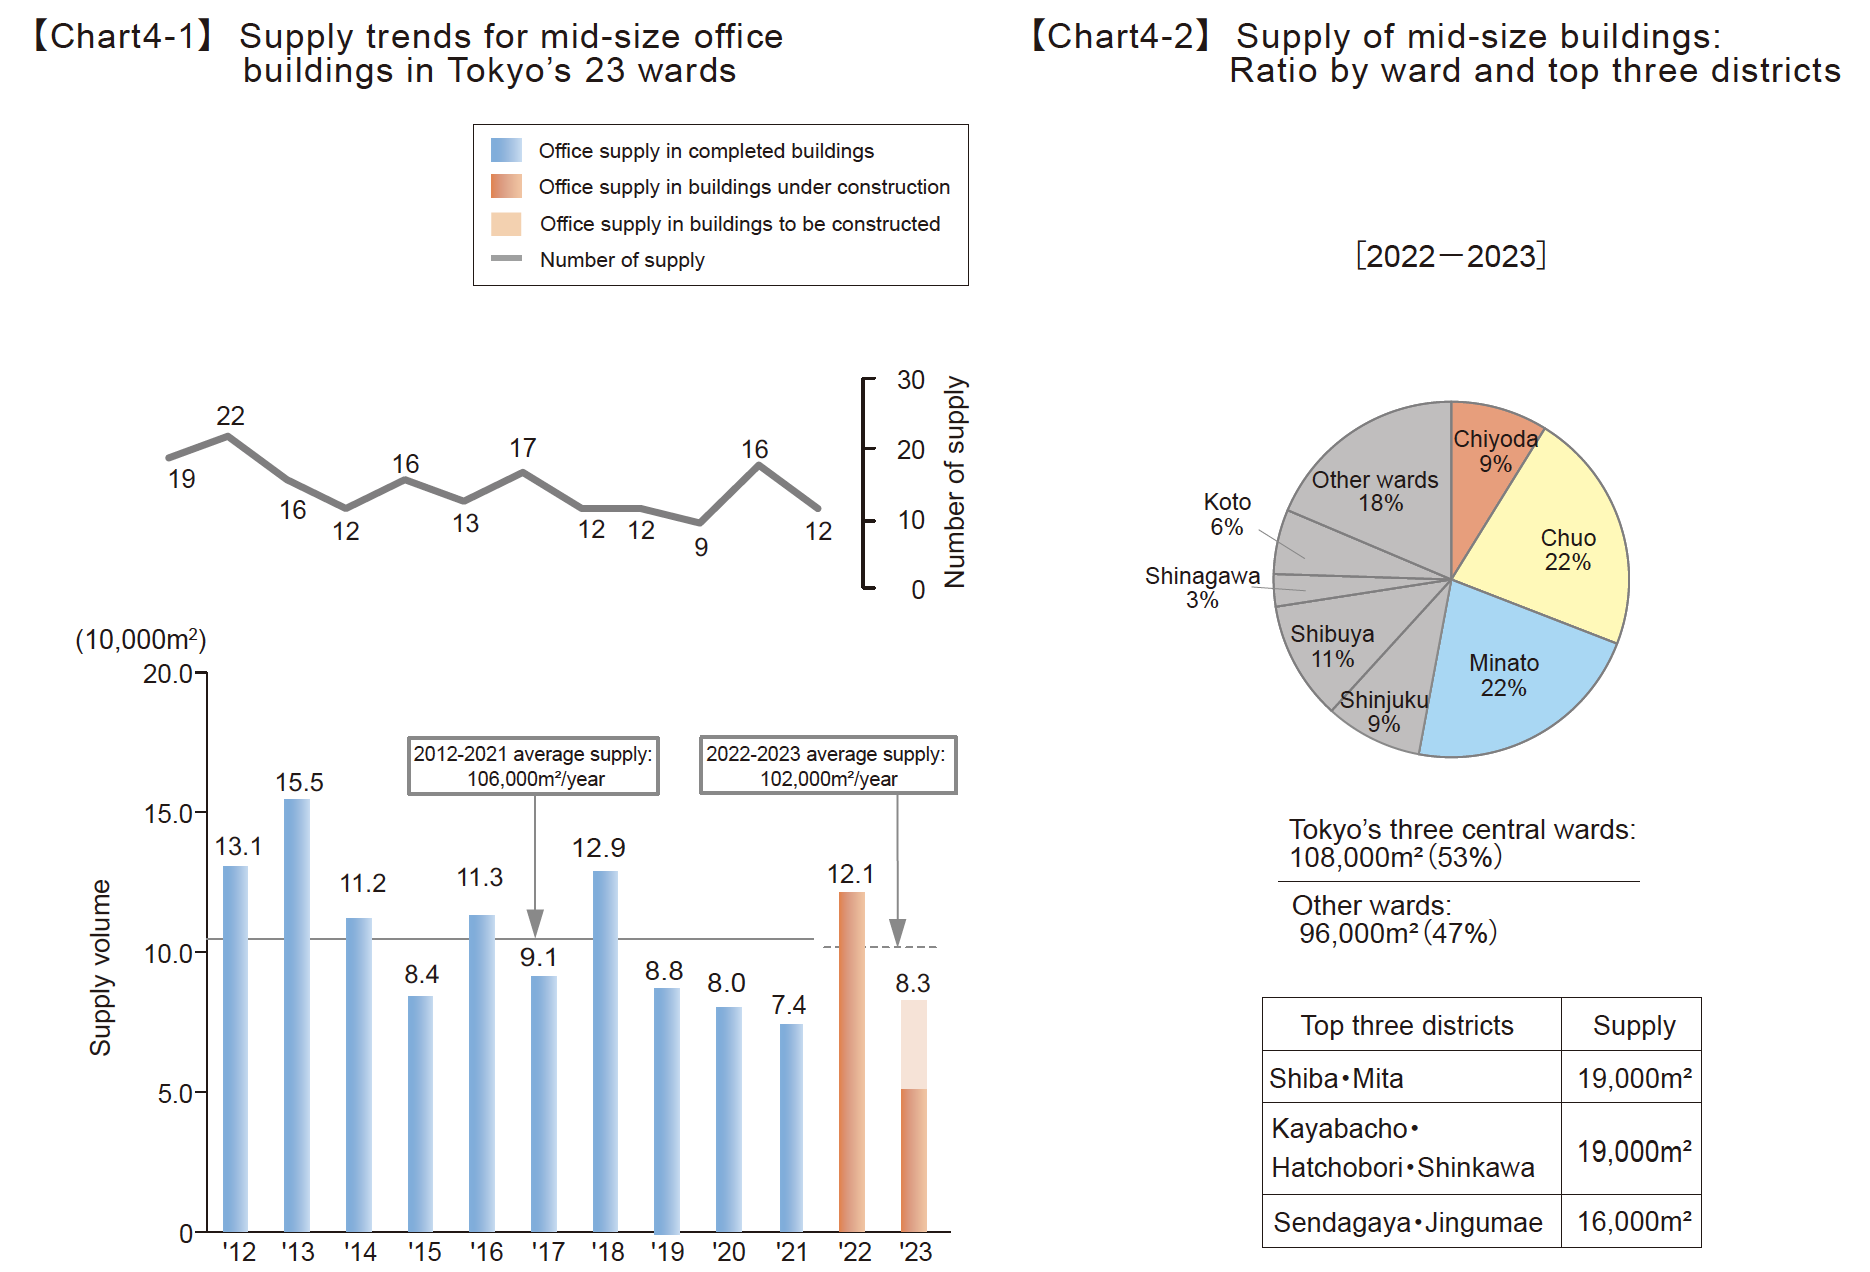
The supply of medium-sized office buildings in 2023 was 66,000 m2, marking another decrease compared to 2022, when there was a large supply. Looking at future trends, supply is expected to increase to 124,000 m2 in 2024, but remain small at 67,000 m2 in 2025. The average supply volume over the next two years will be 96,000 m2, roughly equivalent to the average supply volume over the past 10 years, and is expected to remain stable. [Figure 4-1]
Looking at the supply ratio by ward from 2024 to 2025, the ratio of the three central wards exceeds 80%, and the ratio of the three central wards is larger than that of large-scale offices. [Figure 4-2]
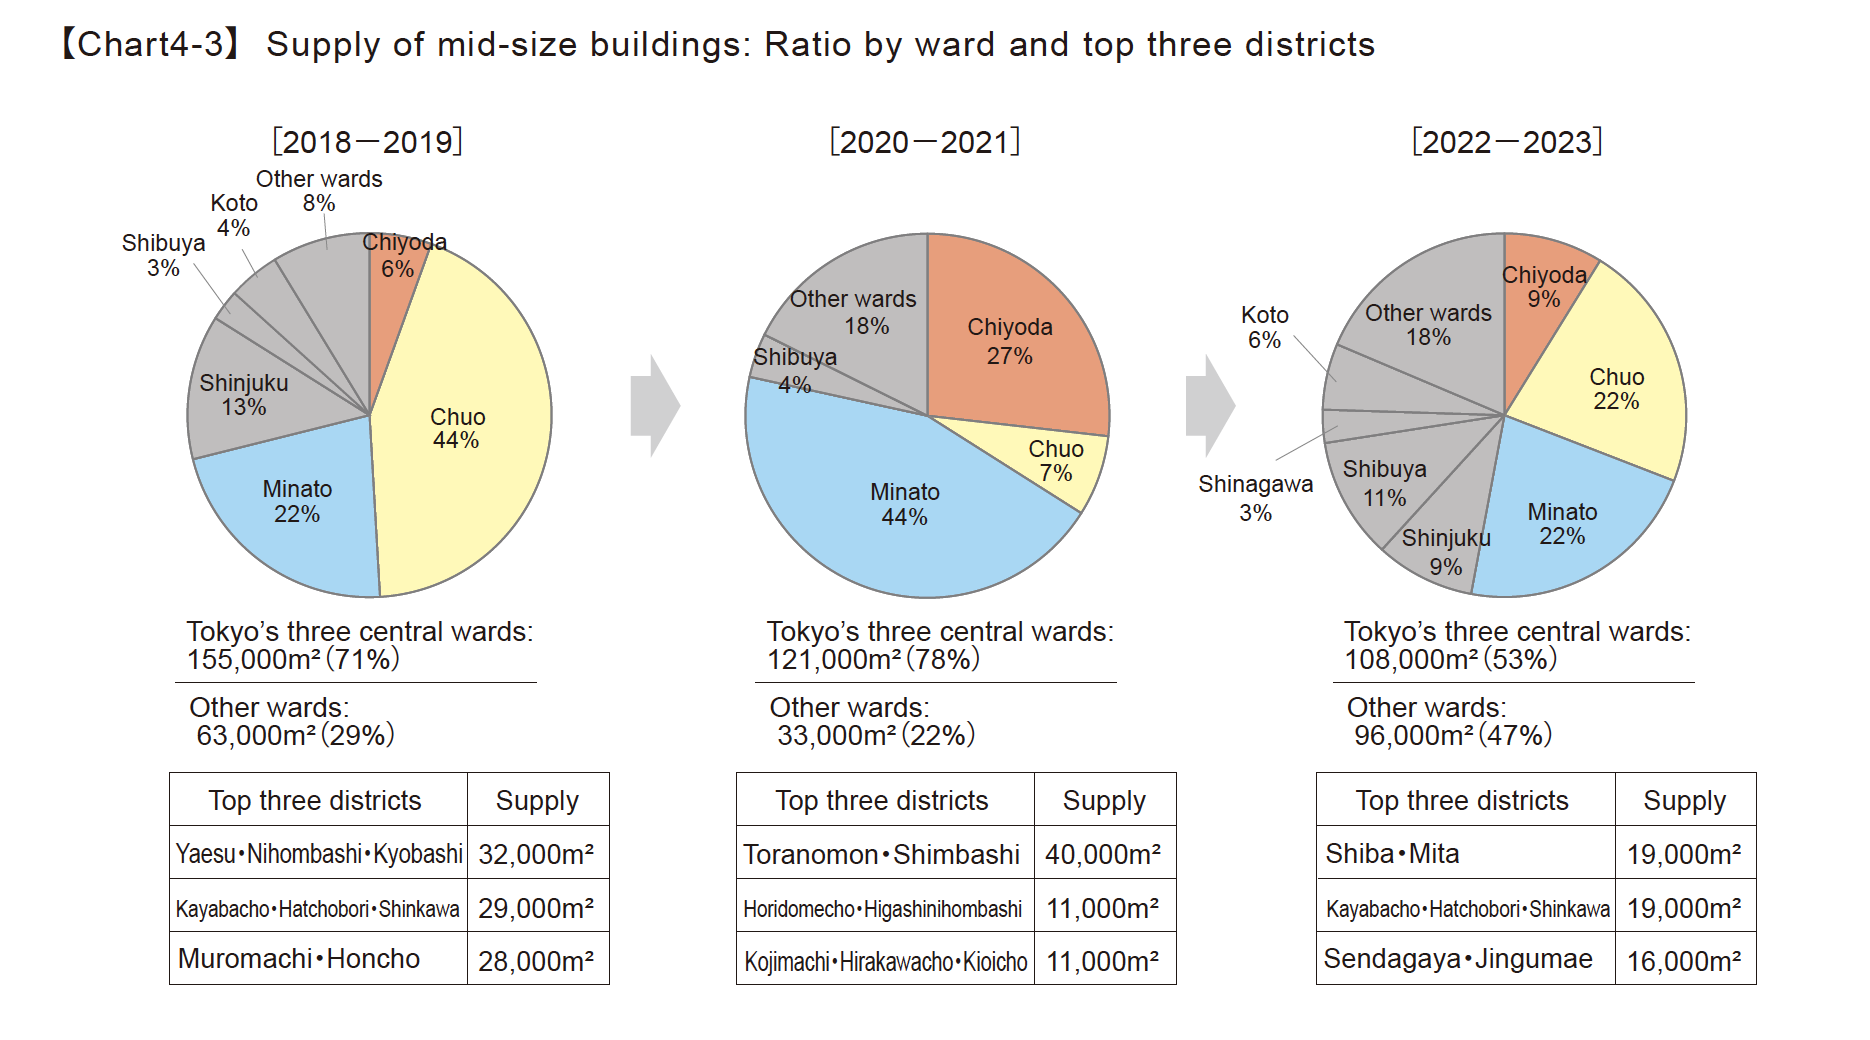
Calculating the supply volume by ward since 2020 in two-year increments and traced the changes in the top wards in terms of supply, we found that the three central wards have consistently accounted for more than half of the supply. Among the three central wards, Minato Ward was the leader until 2023, but from 2024 onwards, Chuo Ward is expected to surpass Minato Ward and become the largest supplier. Looking beyond Tokyo’s three central wards, supply in Shibuya Ward continues, but supply in other wards is intermittent. [Figure 4-3]
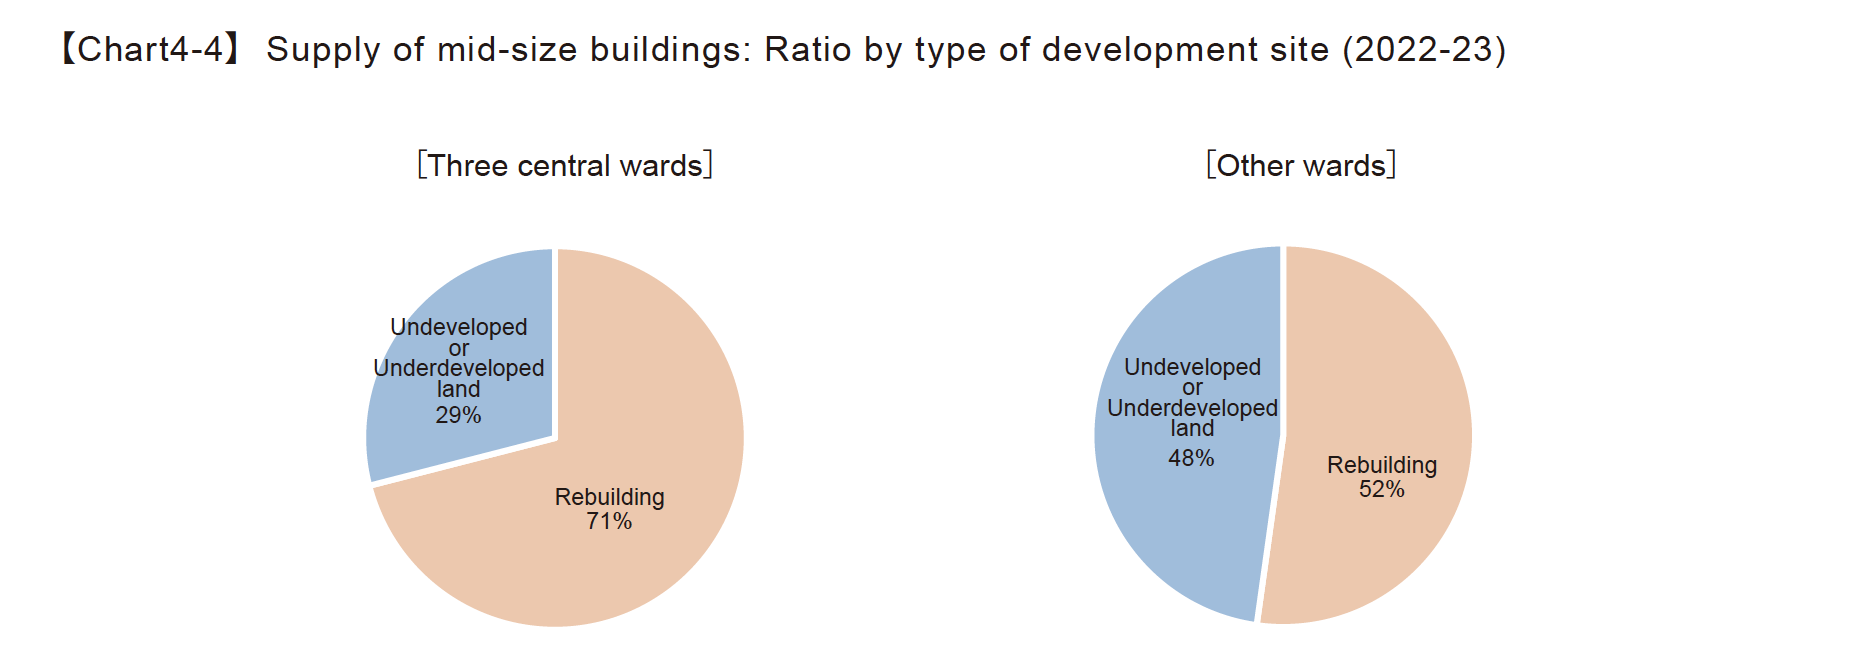
Looking at the supply trends for medium-size office buildings by type of development site, the main focus in the three central wards and wards other than those is “Rebuilding,” which shows a trend distinct from the trend for large-scale office buildings, for which construction on “Underutilized and unused land” is the main category. [Figure 4-4]
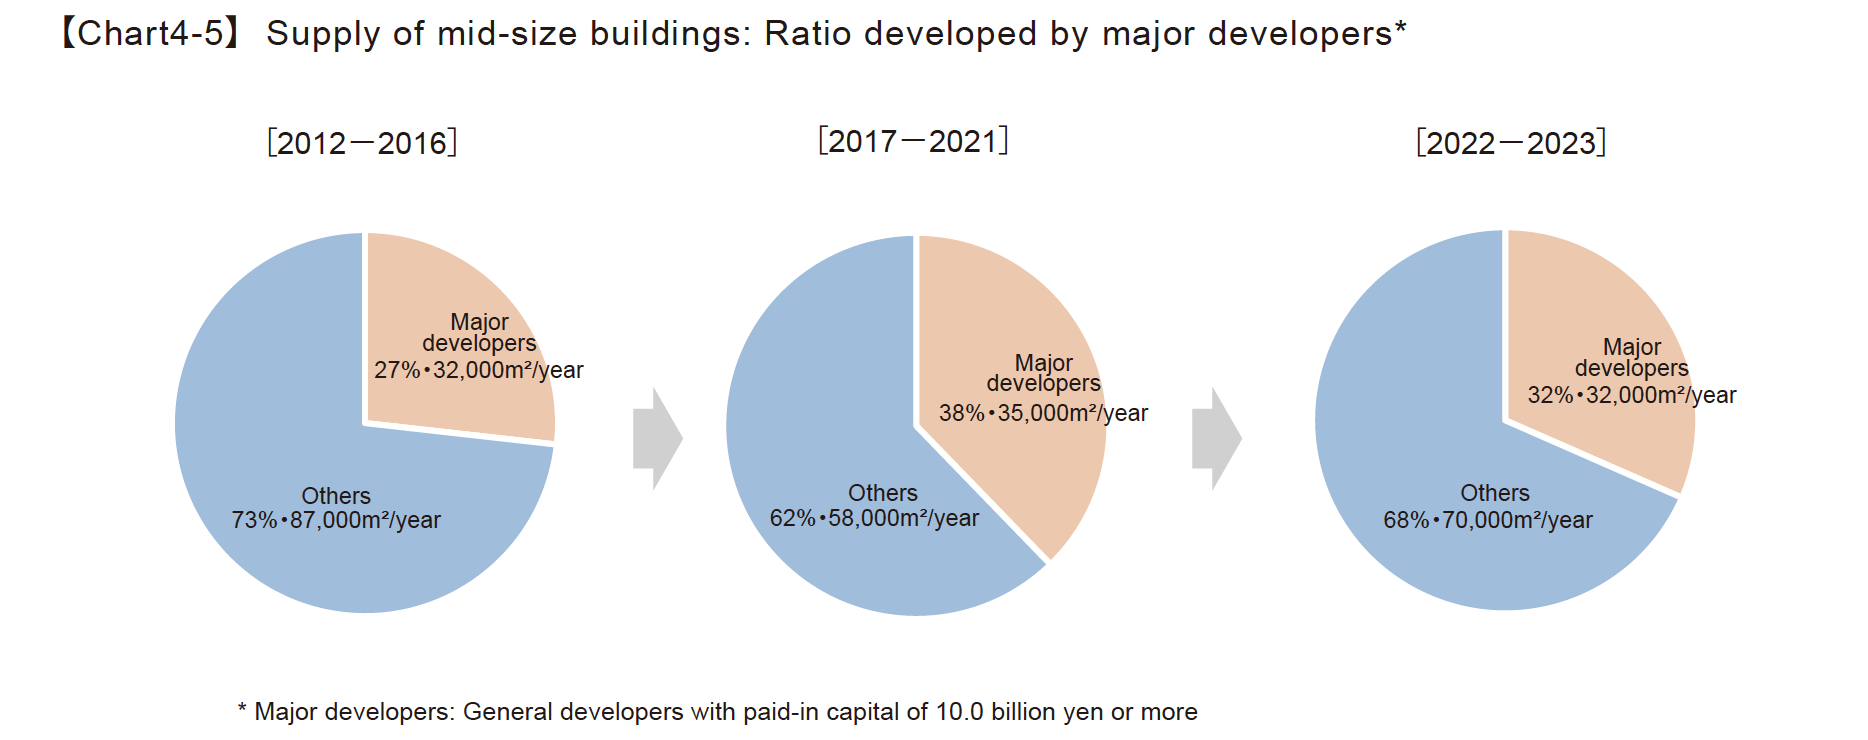
Looking at the developers of medium-sized office buildings, the proportion of major developers was around 30% from 2014 to 2018, but has been increasing in recent years, rising to nearly 50% from 2024 to 2025. [Figure 4-5]
- Data showing percentages may not add up to 100% because they are rounded off to the nearest whole number.
